In business, it all comes down to profit. In farming, profit comes down to things we can’t control like the weather and the markets, and the things we can control like our management decisions.
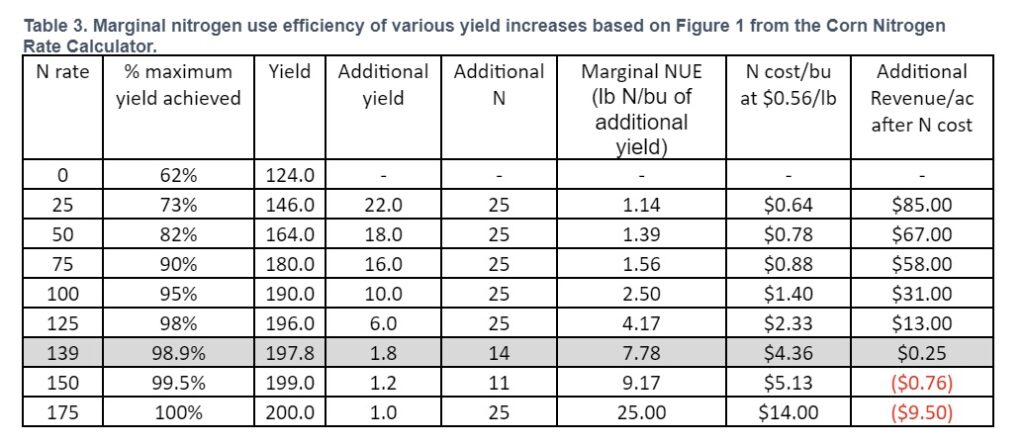
One of those key management decisions is determining how much nitrogen to apply to our crops. In part two of this series, I described the yield/input/profit paradox that leads many producers to over apply nitrogen, reducing their profitability in the process. Table 3 in this post should make this a bit easier to understand.
Let’s do the same analysis again using Table 3 as a guide. As you will see, there is nothing optimal about pushing N rates up to the MRTN. Look at Column 7, the per-bushel cost of additional nitrogen to achieve the next incremental yield bump. This tool only accounts for purchased N cost. No other expenses are included. To go from 190 to 196 bushels per acre yield takes over 4 lb N/bu, for a cost of $2.33/bu just for the nitrogen. If the actual yield was less than 200 bu/acre the cost is even higher. Going beyond the 125 lb N rate starts to look very questionable if you are paying even more for N. Does it really make sense to apply the MRTN rate of 139 lb of N to push yield to the point of zero return on that last pound of N? Getting from 196 to 197.8 bu/ac yield takes almost 8 lb of N per bushel. It generates very little return over the N cost, damages the environment, and limits future productivity.
Many farmers actually apply N well in excess of what the Corn Nitrogen Rate Calculator recommends because it is ‘cheap insurance’ against unpredictable weather. The odds are they are losing money (and N) with that strategy. Squeezing out the last bushel of yield with another 25 lb of nitrogen leads to a loss of almost $10/acre. This cheap insurance is not cheap at all. In fact, it is one of the most expensive and damaging practices in agriculture.
Looking at overall NUE can be misleading. In this scenario, corn yielded about 198 bu/ac with 139 lb of N, for a NUE of 0.7 lb N/bu. That’s actually a very good NUE relative to where most producers are today. But it hides the fact that the first 124 bushels were obtained with zero nitrogen! Looking at marginal NUE is a better way to gauge efficiency. What really matters is how efficient was the nitrogen application for the bushels that actually used the nitrogen. The only way to determine this is with rate trials that include zero N check strips. Run zero N yield checks every year to see what your soil will produce without purchased N, estimate how much N it takes to get those last few bushels of yield, and ask yourself if the costs are really worth it.
In addition to creating a “profit drag” on our farms, overapplying nitrogen leads to more N loss to the environment via nitrate leaching, volatilization, and denitrification. We have high nitrate levels in rivers and groundwater wells all over the Midwestern U.S. as proof that our N management has been negatively impacting water quality for decades. A vast majority of this N is from agricultural sources. Excess N also degrades soil structure, a topic I covered in a previous blog post.
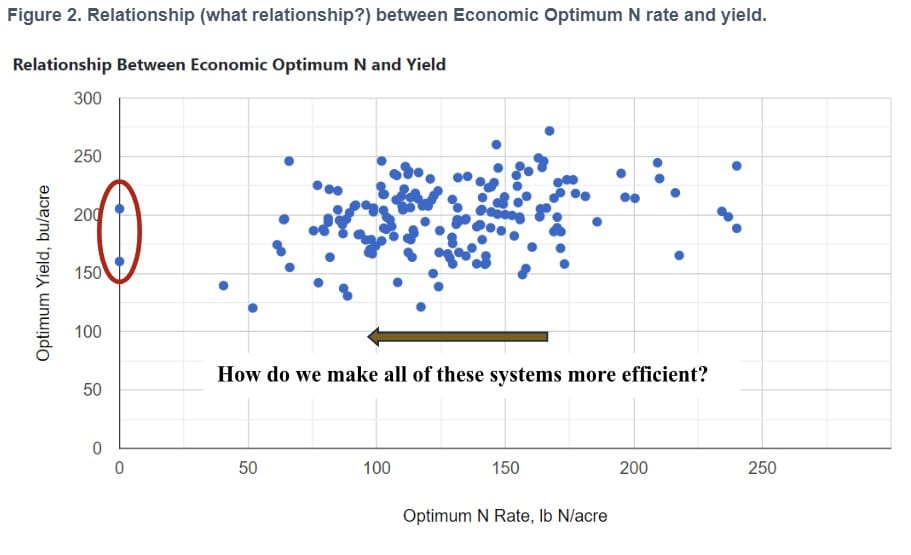
Figure 2 shows the data that went into the yield curve in Figure 1. If you squint and turn your head sideways while hanging upside down, you might convince yourself that there is a significant correlation between optimum N rate and yield. The point is, there are many other factors that drive yield. We do not need to apply anywhere near the amount of N that is typically applied on most farms.
Think about the two dots at the far left of the graph. The optimum N rate was zero! Those two trials yielded between 160 - 205 bu/ac with no nitrogen applied. How did that happen? And how can we move all of those dots to the left so that in any given year you can achieve the same yield with less N? Soil biology and weather are in charge. Nitrogen is just one piece of the puzzle. It’s important to note that these trials were likely not run in cropping systems that were managed for healthy soil. The question we should be asking is how can we manage our soil to maximize free N production so we can move all of those dots to the left (and our per-acre profits higher)? We do this by accounting for the role of soil biology and ecosystem processes, rather than viewing the soil as an inert growing medium.
A big challenge with determining the right nitrogen rate is that it is a moving target due to weather, which is unpredictable. That’s partly why Figure 2 looks like a random pattern. The best rate one year may not be the best rate another year, and you don’t get your report card until harvest. This makes selecting the right timing and the right source of nitrogen very important. Having a system where the plants are able to access what they need when they need it regardless of weather is key to optimizing nitrogen. I will discuss this further in parts 4 and 5.
If you want to do a better job of managing nitrogen to improve profitability and reduce environmental harms, you must run rate trials with zero N checks on your own farm to determine how much N you can justify applying. Yield should never be considered in isolation from marginal N use efficiency, and N should not be applied up to and beyond the point of zero return without an honest accounting of the negative effects of doing so.
The thought process that leads us to applying N beyond the marginal NUE breakeven is the same kind of thinking that has led to polluted drinking water and a large dead zone in the Gulf of Mexico. It is a recipe for disaster for all of us. Implementing the soil health principles and letting nature make some nitrogen for us is a much safer, and in the long run, much healthier and more profitable way forward.
In part 4, we will drill in on the importance of living ground cover and avoiding overapplication of nutrients at the wrong time.


